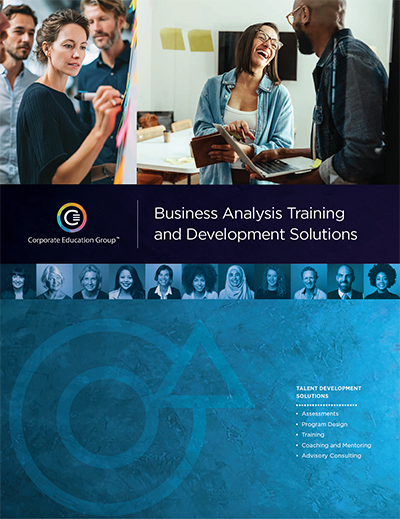
Business Analysis
Business analysis plays a critical role in driving organizational performance, innovation, and change. Corporate Education Group (CEG) offers comprehensive business analysis training and certification programs designed to help professionals develop practical skills, enhance analytical thinking, and align with industry standards such as the BABOK® Guide. Our expert-led courses and business analysis coaching programs provide a solid foundation in the framework for business analysis, from defining requirements and managing stakeholders to improving business processes and enabling data-driven decisions. Whether you’re pursuing business analyst certification, refining your skills through corporate training, or seeking best practices for business analysis success, CEG’s tailored learning solutions empower you to achieve measurable impact across your organization.
 Course List
 Certificate Programs
 Assessments
 On-Demand Webinars
Why Business Analysis Training Matters
Enhance Project Outcomes
Business analysis training strengthens more than individual skills — it improves how projects are defined, aligned, and delivered, as outlined in 10 Ways Business Analysis Training for Your Team Can Enhance Project Outcomes.Learn MoreBusiness analysis training is essential because it equips professionals with the tools and frameworks needed to identify business needs, define effective solutions, and drive measurable organizational results. By learning structured approaches such as those outlined in the BABOK® Guide, participants gain critical thinking, communication, and stakeholder management skills that directly influence project success. Corporate Education Group’s business analysis training helps individuals translate complex data into strategic decisions, align teams around common objectives, and foster innovation across processes and systems. Ultimately, investing in business analysis training builds stronger business analysts—and stronger organizations.
For more information on this topic, as well as how Corporate Education Group can help power your organization’s performance, contact us via email or call 1.800.288.7246 (US only) or +1.978.649.8200. You can also use our Information Request Form!


- ©2026 Corporate Education Group, operated by CEG Operating Company, LLC. All Rights Reserved.
Privacy Policy | Terms and Conditions - Corporate Education GroupSM and Learning That Powers PerformanceSM are service marks of Corporate Education Group, Inc., PMI®, PMP®, CAPM®, PgMP®, PMBOK®; and the PMI®; Registered Education Provider logo are registered trademarks of the Project Management Institute, Inc. CBAP® and IIBA® are registered trademarks of International Institute of Business Analysis. All other trademarks mentioned on this site are property of their respective owners. All rights reserved. CEG is an approved Authorized Partner within the Blanchard Authorized Partner Program and is licensed to market, sell, and train SLII®.

